
Social media allows people to share information, exchange ideas and build community around common interests, causes or concerns. Social media content is fluid, interactive and user-generated so devising and tracking ways to measure content and associated networked activity can be less precise than tracking structured business data.
What you measure varies based on the business and the available metrics in each channel. Some standards include the number of followers, engagement (likes/comments/ shares) and social media text to analyze users’ sentiments and group key topics or feedback. These kinds of reactive metrics are descriptive analytics. They help organizations understand what is happening and how are they doing, and account for the vast majority of social media analytics.
#LikeAGirl
I like to communicate causes and found a campaign that goes back to 2015 publicized by Always, the brand that sells menstrual pads, a somewhat taboo topic. The Always website states its commitment to building girls’ and women’s confidence, so this video supports that aim with a post about gender identity.
A look at key public metrics for this post: Facebook: 41k views, 232 likes, 20 comments – July 15, 2015 at 2:17 p.m. I could not find the shares for this particular post. On YouTube similar metrics show 102,970 views and 724 likes from May 3, 2018.
In comparison to benchmarks for social media found through a ChatGPT search for the consumer-packaged goods category where the average engagement rate is reported to be 0.16% to 0.5%, the Facebook post didn’t fair as well, whereas the YouTube Channel did. The following calculation is from a Hootsuite social media metrics blog, which uses the following formula to calculate an Average Engagement Percentage Rate on Facebook:
Likes/comments/shares divided by Total Followers x 100 (252 divided by 448k FB page followers x 100)= 0.056
Beyond these visible social media metrics, the company may track web traffic, product sales and brand attributes like “Confidence” and monitor comments made in social media containing empowering phrases. The specific comments found in the above Facebook post were all affirming and frequently included @mentions to spread the message organically.
According to the book, Creating Value with Social Media Analytics by Gohar F. Khan, one of the challenges in using social media analytics is how unstructured and disparate the metrics are across channels. This can make it challenging to report and use social media analytics to inform business decisions.
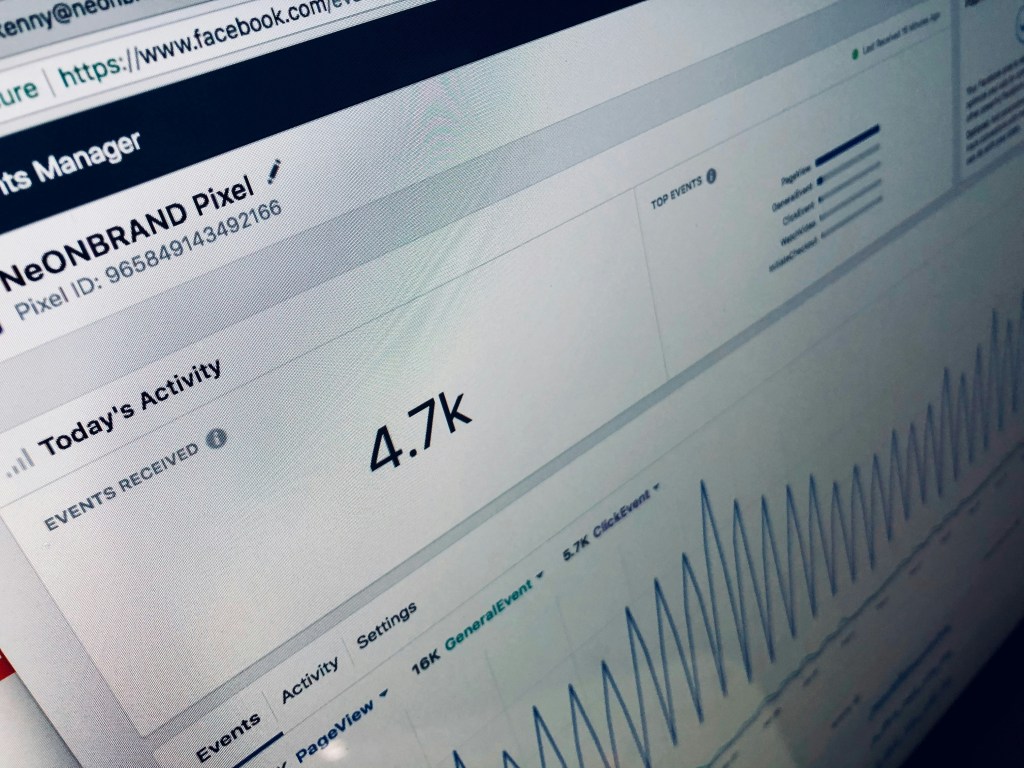
In the real world there are several analytics tools to help social media practitioners analyze how well an organization is reaching its audiences. Each channel has its own analytics and there are tools that tout aggregation across media, including SAS Visual Analytics and some of the publishing platforms like Sprout Social embed their own customizable analytics tools. I wonder how reliable these sites are compared to the more manual method of going into each site individually and extracting the necessary data. In this brief TikTok tutorials, we learn all the analytics available locally including followers, profile views, comments and video views. Once extracted, social media data may need to be cleaned, analyzed, visualized and interpreted to be able to present easy to interpret findings.
Always seems to be creating a brand that stands for something well beyond the products it sells. What social media metrics do you care about the most? Keep the conversation going at linkedin.com/in/juliacasey1

Responses to blog