Category: Data Visualization
-

As one of the most diverse towns in Connecticut, the city of Hartford has its fair share of challenges that radically affect the life of any teen who attends one of its three high schools. Chronic poverty, drug and alcohol addiction and daily obstacles make high school graduation, let alone college readiness, out of reach…
-

Maps are powerful communication tools for visualizing geographic data. Utilizing platforms like DataWrapper, users can create customized, impactful maps that draw people into the story being told.
-
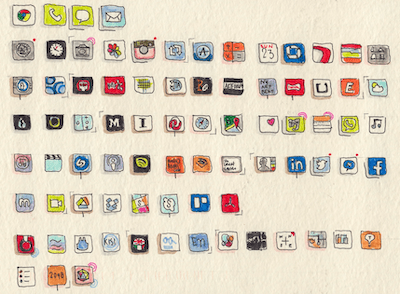
“Dear Data” started as a creative exchange between two friends, exploring personal data through artful visualizations. This week I try the approach by capturing meal timing for weight control. This process emphasizes imaginative data representation, fostering self-reflection and deepening friendships.
-

Data visualization simplifies complex information and helps to engage a variety of audiences. This article explores the types of data analysis and most commonly used visual formats for communicating clearly with a range of audiences. Personal data tracking, like meal timing, reveals patterns. Engaging presentation styles enhance data storytelling, making insights more impactful.
-

Effective data visualization requires clarity and understanding in visual presentations. In contrast to big data samples the blog looks at the merits of capturing and coding personal information, including when plants bloom. This highlights how visualization can foster self awareness and human connection.
